The Colombian Peso has been hit hard since the middle of 2014, with Columbia’s energy-dependent economy suffering from the precipitous drop in crude oil prices. Petroleum products comprise more than 45% of exports, making GDP highly sensitive to commodity price swings. While diversification into information technology, shipbuilding and tourism has eased the impact in recent years, petroleum exports still represent the country’s primary source of capital.
Colombia has experienced a historic boom in the last two decades, and is currently Latin America’s fifth largest economy. The growth curve heightened during crude oil’s dramatic ascent between 1997 and 2007, helped along by a return to law and order, after the criminal culture of drug cartels receded from the public’s consciousness. However, growth rates have eased since the middle of 2014, with crude oil losing more than half of its value and falling to a six-year low.
Crude oil has come well off its lows in the summer of 2015, in reaction to much needed supply cuts, as well as conciliatory statements from the Organization of Petroleum Exports (OPEC). Even so, it may be counterintuitive for a cross of the Colombian Peso with the USD Dollar (USD/COP) to offer a profitable trade or investment, but now’s a perfect time to consider a short sale that marks a bullish bet.
As a non-member oil producer, Colombia has been hit especially hard by an OPEC supply buildup that’s forced the country to lower production at the same time that prices have collapsed. However, the tide may be turning, supporting an increase in growth rates that will underpin the value of Colombia's currency. Against this backdrop, market players with an appetite for risk should now watch key price levels for an entry signal.
Colombian Peso Technical Analysis
The following technical signal applies a technique outlined by Wall Street trader Victor Sperandeo in his 1991 book "Methods of a Wall Street Master." His 2B Sell pattern sets into motion when a security rallies above a major resistance level but fails to generate bullish momentum. (For more, see: Beat the Market With a Strong Pattern Failure Strategy.) A counter-swing below the breakout level generates a sell short signal that’s managed with a stop loss above the rally high.
Monthly USD/COP Chart

USD/COP topped out near 3000 pesos in 2002, and sold off to the 1500 level in 2007. A buying spike during the 2008 economic collapse leveled off when world economies began to recover, dropping the instrument into a test of the downtrend low. It ground out a 5-year rounded bottom across 1800 pesos and entered a new uptrend in July 2014,
in reaction to crude oil’s downtrend.
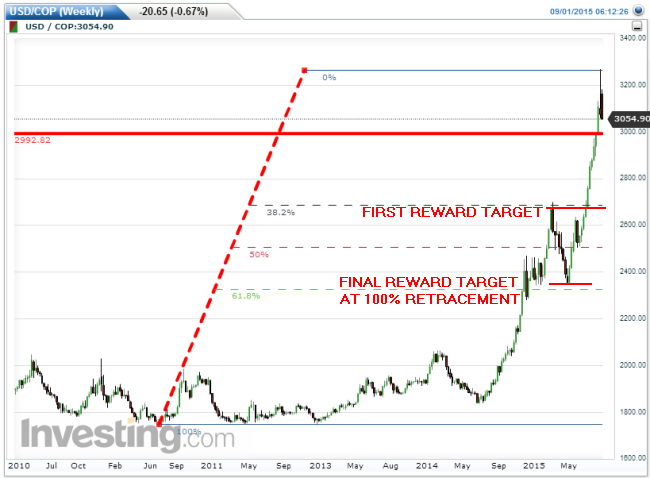
The cross rallied above the 2002 high in August 2015, signaling a major breakout, but momentum faded as soon as the rally pierced 3200 pesos. It was trading less than 100 pesos above the breakout level at the start of September 2015, setting up a test at new support, with a selloff through that level signaling a failed breakout and 2B Sell signal that could end the long uptrend.
Weekly USD/COP Chart

In addition to the technical signal, a decline through 3000 pesos may escalate because bulls who bought the breakout will need to sell positions at a loss. In turn, this could generate a feedback loop and downside momentum that drops the cross toward intermediate support just above 2600 pesos. A Fibonacci grid laid over the weekly uptrend aligns tightly with that level while the 100% retracement of the last rally wave offers a final downside target below 2300 pesos. (For more, see: Placing Fibonacci Grids Is Key to Your Trading Strategy.)
The Bottom Line
The Colombian Peso is closely levered to crude oil prices because more than 45% of Colombia’s exports are petroleum products. Signs are growing that energy markets are finally bottoming out, allowing the currency to recover its value in a profitable trend against the U.S. Dollar.
