futures entered a steep bear market in 2014, following a multi-year trading range set into place after the 2008 economic collapse. While futures and equity buyers have lost fortunes trying to pick the bottom, many currency traders have prospered, taking advantage of tight correlation between energy futures and forex pairs that react to the sector’s high volatility. Let’s identify these correlations and how they trade, with a sharp focus on applying this knowledge to the gyrations in the crude oil market.
Given the wild price actions in 2014 and 2015, it’s likely the energy sector will carve out wide swings and multi-week trends for the next two-to-three years at a minimum, offering forex players numerous opportunities to profit. We will focus on the most popular and highly liquid pairs, with tight bid/ask spreads and easy access for U.S. currency traders. More thinly traded instruments may work as well, but they tend to carry higher costs. Most of these crosses can be found in Central and South American nations that are highly dependent on the price of crude oil. These include Brazil, Columbia, Venezuela and Mexico.
Canadian Dollar
Not surprisingly, Canadian forex crosses show tight correlation with crude oil contracts. The resource-rich nation has massive energy reserves, which strongly impact gross domestic product (GDP) and foreign trade balances. (For more, see The 5 Biggest Canadian Oil Companies.) Since crude oil is calculated in U.S. dollars, the USD/CAD pair works as a nearly perfect proxy for crude oil gyrations -- both higher and lower.
This pair generates an inverse correlation since the Canadian dollar represents the denominator in the cross, advising traders to look for the pair to rally when crude oil is selling off and vice-versa. The correlation tends to ease up when precious and industrial metals are moving more forcefully than crude oil because mining produces the country’s other great source of natural wealth.

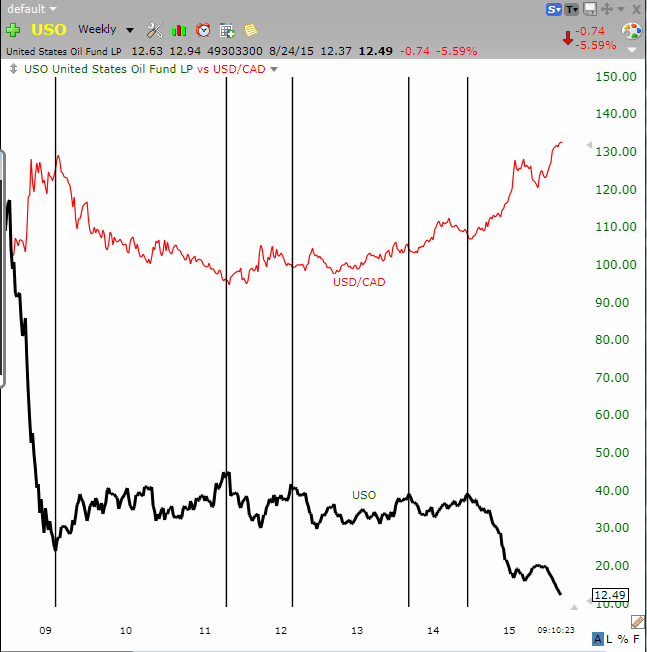
The U.S. Oil Fund (USO), an exchange-traded equity proxy for the WTI crude oil contract, and the forex pair USD/CAD, show tightly inverse price action between the 2008 to 2009 bear market and the third quarter of 2015. The cross topped out in 2009 when crude oil pounded out a bottom and entered a two-year uptrend. In turn, USD/CAD turned lower in a perfectly inverse two-year downtrend. The instruments turned once again in 2011, with crude oil posting a recovery high, ahead of a three-year trading range.
The correlation eased up between the 2011 reversals and the 2014 breakaway trends. USD/CAD entered an uptrend during this interim period, while crude oil ground sideways, testing upper and lower boundaries. The relative detachment points out a common but poorly understood characteristic of correlation—it tends to expand during periods of rising volatility and contract when volatility eases up.
The USD/CAD uptrend escalates in June 2014 when crude oil enters a new downtrend, breaking multi-year support and heading into a test of the low posted in the prior decade. The Canadian cross responds with a rally to an 11-year high. It tends to lead the futures contract throughout this period, acting as a leading indicator for gyrations in the energy pits.
Australian Dollar
The Australian dollar cross against the U.S. dollar, trading as AUD/USD shows high correlation with crude oil as well. This appears unusual at first glance because Australia holds just 0.3% of the world’s oil reserves. However, the country has massive copper, gold, iron ire and nickel reserves that dominate its GDP, highlighting the correlation between commodity classes, especially in recent years. Electronic trading and new derivatives have tightened these relationships because broad commodity baskets can be bought or sold as risk-on or risk-off hedges in reaction to shifting sentiment in the equity and bond markets.

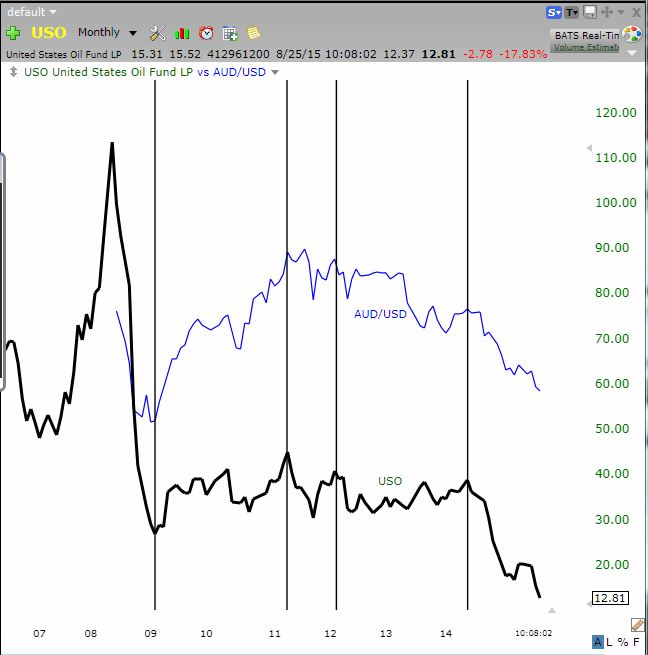
Crude oil and AUD/USD bottom out in unison in 2009 and enter similar uptrends that extend into historic 2011 highs that haven’t been breached in recent years. While the correlation declines between the 2011 highs and 2014, the instruments follow similar trajectories, with relative highs and lows occurring at the same time.
The instruments break down in strong downtrends in the middle of 2014. Crude oil gets cut in half during this period, while AUD/USD drops approximately 25%. Relative highs and lows intensify correlation readings, with nearly identical price action into the second half of 2015. This lockstep behavior should ease up when crude oil begins the inevitable bottoming process, lowering volatility levels.
The percentage change differential illustrates how correlation impacts trend direction and price structure across instruments but does not predict the size of gains or losses. This is especially true when working with currencies because they exhibit price band behaviors that stretch across many decades while other instruments can, theoretically at least, rise to infinity or fall to zero.
The Bottom Line
U.S. dollar crosses with the Canadian and Australian dollars offer easy access to crude oil gyrations since both crosses show extremely tight correlation with the energy markets. This correlation has grown even stronger in the recent years, with crude oil now working through a volatile downtrend.
