A looming Federal Reserve (FOMC) rate hike (the first since 2006) is expected to underpin the US Dollar (USD), lifting it against major currency pairs and staging strong rallies against financial centers that have adopted fiscal stimulus programs to strengthen local economies. These currently include Europe, through the European Central Bank (ECB), and Japan, through the Bank of Japan (BOJ). But do the expectations hold up when we compare them to past rate hike cycles?
USD and Rate Hike History
When the FOMC began to raise rates, in July of 1987, the USD fell for several months. America's financial markets were overheating in a parabolic rally at that time, forcing volatile gyrations through financial instruments that ultimately triggered a major crash, which took place on October 19th. This volatile event forced the Fed to backtrack and cut interest rates the very next day.
DXY- Monthly

During the rate hike cycle that started in 1994, the FOMC issued its first rate on February 4th, with additional hikes on March 22nd, April 18th and May 17th. That year, the USD fell consistently before joining with equity markets in a strong uptrend during the 1st quarter of 1995. This cycle occurred inside of a less volatile world market environment than existed in 1987—suggesting that volatility levels and relative pricing affected subsequent USD performance.
The USD had already started to rise in months ahead of the single rate hike of March, 1997, with the uptrend accelerating into a 2001 all-time high. Once again, environmental contrasts with prior cycles had a significant impact, with world economies working through benign conditions in 1994 but shaking off the Asian Contagion in 1999, at the same time that the Internet bubble was working towards its its manic peak.
The June, 2004 rate hike cycle generated counter-correlation with USD, coming off the heels of a strong 2002 and 2003 recovery after world economies bottomed out following the 2000-2002 bear market. The USD fell sharply from its 2001 rally high, continuing lower into the 2008 bear market, even though the Fed began lowering rates at the end of 2007 and kept reducing them into 2009.
Looking Forward
The quantitative easing stimulus program, introduced in November 2008, had a significant impact on USD performance until bond purchases were finally ended, in October, 2014. The USD dropped into a holding pattern in the lower third of its historic range when QE was introduced and held tightly within those boundaries throughout the period. It took off in a strong rally when the program finally ended, with the uptrend topping out early in 2015 and dropping into another holding pattern while world markets prepared for a new rate hike cycle.
The last four rate hike cycles shows weak or no correlation with USD performance. This is especially evident in the 2004-2007 period, which provided a near-textbook example of worldwide economic growth that should have elicited a stronger American dollar. Instead, the massive commodity rally during that period put intense pressure on USD, due to stronger correlation between those instruments.
While USD direction after the upcoming rate hike is tough to predict, the event is likely to trigger a new trend (whether higher or lower), which is what's happened at the start of every cycle for the past 20 years. And, while the trend could go either way, analogs show a tendency for USD to follow the direction in place prior to the hike. This suggests higher prices in the future, with a break above the US Dollar Index (DXY) 100 level. The monthly technical setup supports to this conclusion, but's there no advantage in assuming risk until DXY crosses important price levels.
U.S. Dollar Index Technicals
DXY - Weekly

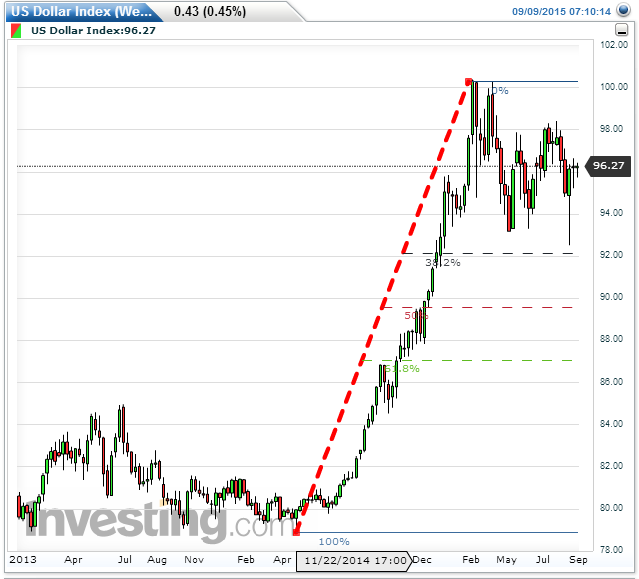
The US Dollar Index entered a strong uptrend in October, 2014, when the FOMC discontinued quantitative easing, shooting up to a 12-year-high at 100, in February, 2015, and dropping into a trading range that held in place through the middle of that year, ahead of the anticipated 4th quarter rate hike. This marks a holding period, with traders unwilling to place big bets until the Fed finally acts.
The decline has held above the 38% retracement of the strong uptrend, giving the weekly chart a bullish appearance that suggests renewed buying pressure after the news. However, adverse opportunity-cost for positions in both directions within the trading range suggests that bulls should stand aside until price breaks above 100, issuing a momentum buy signal that could support a rally up to 115, where resistance from the 2001 top comes into play.
Alternatively, a breakdown through the 38% retracement at 92 would issue a sell signal for bears, suggesting the rally has come to an end and favoring a downside thrust that could reach the mid-80s. In both cases, the most reliable strategy heading into future FOMC meetings will be to watch from the sidelines and allow price action to dictate which side offers the greatest USD profit opportunity.
The Bottom Line
Many market participants expect the US Dollar to rise after the start of the next rate hike cycle, but price action after prior hikes does not support this conclusion.
