In last week’s article, we looked at a bullish Pin Bar followed immediately by a bullish Engulfing Entry system to pin a reversal on the AUD/USD Daily chart.
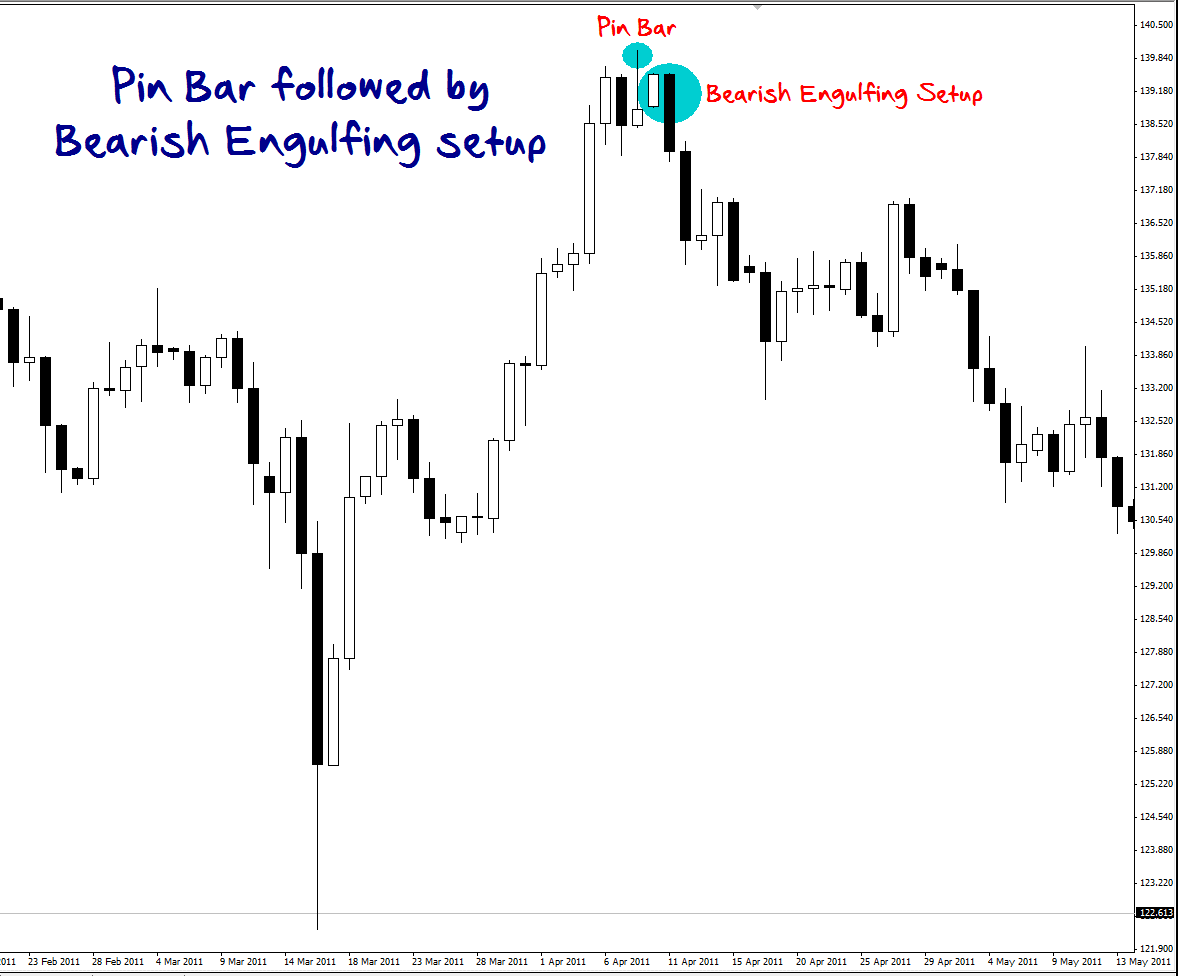
Today, we’re going to look at a mirror image setup: a bearish Pin Bar followed by a bearish Engulfing Entry Setup on the GBP/JPY Daily chart. Let’s get right to the chart:

The price trends up before marking a bearish Pin Bar candle. Now, by itself the Pin Bar may not have given you a reason to go short because that level did not coincide with any clear resistance. However, it was immediately followed by a bearish Engulfing Setup. Combined, the short entry setup was very clear.
Entering at the open of the next candle after the Engulfing Setup, you’d have hit your 1:1 risk/reward within just 1 candle (+162 pips). A few candles later, 1:2 risk/reward was hit (+324 pips). (The stop-loss was just above the second candle that created the Engulfing Setup.)
Notice the two candles before the Pin Bar. Is that a bearish Engulfing Setup? No. The second candle’s wicks are two long. For an Engulfing Setup to be valid, each candle must have wicks less than a third or 33% of its entire length. The candle immediately prior to the Pin Bar had wicks equal to 42% of its length. If you’re not sure by just looking at the chart whether the wicks are short enough, it is best to calculate them.
Even though GBP/JPY and AUD/USD are very different currency pairs, these setups are blind to the fundamentals of each pair. Of course, each pair has its own fundamentals that move their respective prices. But with every pair, the fundamentals create an overall market sentiment that is shown up in price in the same way. And shifts in market sentiment are precisely what Technical Analysis and these setups allow you to spot.
In summary:
1. The Pin Bar and Engulfing Entry Setup can reinforce each other, especially when there’s no previous support or resistance to clarify the validity of the trade.
2. Regardless of differing fundamentals across pairs, these technical setups are neutral and can be traded in exact the same way when they are found on a chart.
